The KIST Europe data set
Introduction
This data set was contributed by T. Mehlhorn of the KIST Europe and M. Dirnberger of the MPI for Informatics. It focuses on networks formed by the slime mold Physarum Polycephalum.
In the following we present a short description of the KIST Europe data set designed to give the interested reader a high-level understanding of the nature of the contained data. In addition, we recommend to inspect the data directly using the available browsing functionality. The expert reader interested in an in-depth exposition of all materials and methods used is referred to the companion paper of this data set.
Description
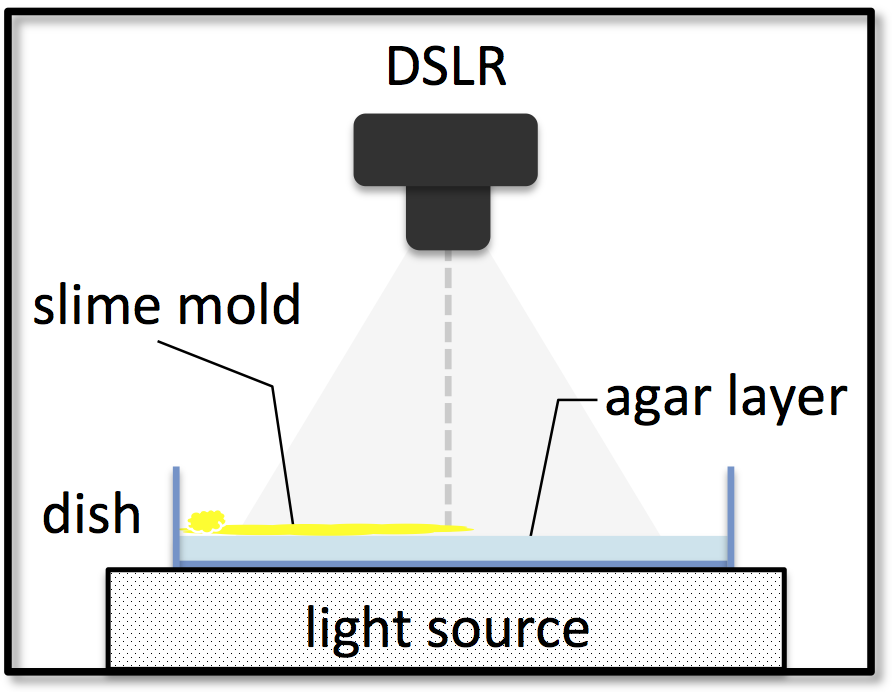
The KIST Europe data set contains raw and processed data of 81 identical experiments, carefully executed under constant laboratory conditions. Figure 1 illustrates the experimental setup. The data was produced using the following procedure:
- A rectangular plastic dish is prepared with a thin sheet of agar.
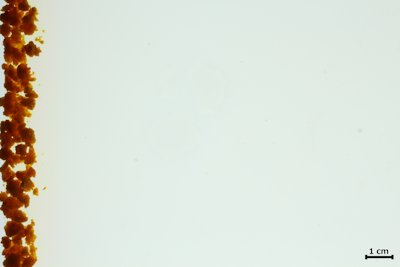
- A small amount of dried P. Polycephalum (HU195xHU200) sclerotia crumbs is lined up along the short edge of the dish, see Figure 2. The dish is put into a large light-proof box
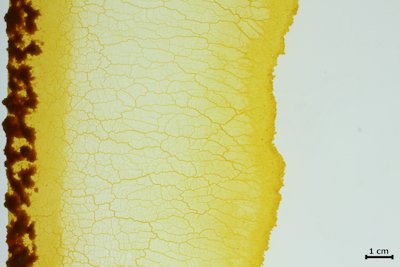
- After approximately 14 hours the plasmodium has resuscitated and starts exploring the available space towards the far side of the dish. Typically, the apical zone needs to cover a distance of several centimeters before network formation can be observed properly, see Figure 3 .
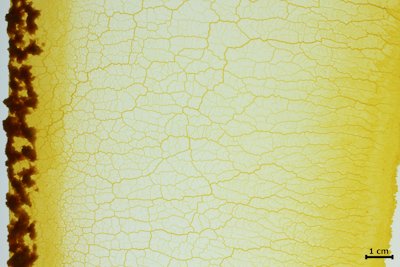
- For the next 30 hours we take a top-view image of the growing plasmodium and its changing network every 120 seconds from a fixed position. A typical obtained image is seen in Figure 4. We stop capturing when the apical zone is about to reach the far side of the dish, which is outside of the observed area.
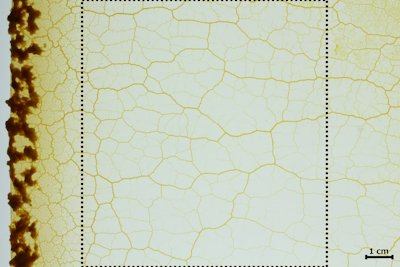
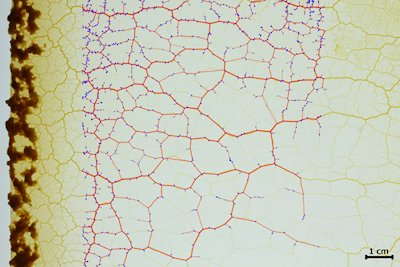
- After obtaining sequences of images showing the characteristic networks of P. Polycephalum, we use a software called NEFI to compute corresponding sequences of graph representations of the depicted structures within a predefined region of interest, see Figure 5. In addition to the topology the graphs store precise information of the length and width of the edges as well as the coordinates of the nodes in the plane. A typical resulting unfiltered graph is seen in Figure 6
- Given the resulting sequence of graphs we apply filters removing artifacts and other unwanted features of the graphs. Then we proceed to compute a novel node tracking, encoding the time development of every node, taking into account the changing topology of the evolving graphs.
|
|
|
|
|
|
Repeating this experiment we obtain 81 sequence of images, which we consider our raw data. We stress at this point that given the inherently uncontrollable growth process of P. Polycephalum, the obtained sequences differ in length and nature. That is to say, in some experiments the organism behaved unfavorably, simply stopping its growth, changing direction or even escaping the container. While such sequences are part of the raw dataset, we excluded them partially or completely from the subsequent graph extraction efforts. The removal of such data reduces the number of series depicting proper network formation to 54.
After obtaining the raw data, we transform the images into equivalent mathematical graphs, thus opening up a wealth of possibilities for data analysis. To this end we deploy a convenient automatic software tool called NEFI, which analyzes a digital image, separates the depicted slime mold network from the background and returns a graph representation of said structure. Using this tool effectively requires some moderate amount of image preprocessing. In particular, for each sequence of images it is necessary to decide on a suitable subsequence to be processed. Here we typically exclude parts of the sequence where the apical zone is still visible. For each such subsequence a suitable region of interest is defined manually. Figure 5 depicts a typical choice for the region of interest to be processed by NEFI. The established unfiltered graph can be seen in Figure 6. The graph stores the position of the nodes in the plane as well as edge attributes such as edge length and widths for each edge. In addition to the output of NEFI including the unfiltered graphs, the dataset contains NEFI's input, i.e. the selected subsequences of images cropped according to their defined regions of interest.
Note that some parts of the image series showing proper network formation did not yield optimal representations of the depicted networks. This is a result of images exhibiting strong color gradients rendering them too challenging for automatic network extraction. While such cases can still be handled by tuning the parameters of image processing manually on an image per image basis, we decided to discard affected series from subsequent processing efforts. As a result the number of usable graph sequences of highest quality reduced to 36 to which we apply a set of filters removing artifacts, isolated small components and dead-end paths. Thus we obtain a total of 3134 distinct filtered graphs faithfully reflecting the topology and edge attributes that P. Polycephalum displayed during the wet-lab experiments. At this point available graph analysis packages or custom written analysis code can be deployed to investigate the data in various ways. The dataset includes the filtered graphs as well as all corresponding graph drawings. The latter enable a quick visual inspection of the results of the graph extraction.
Given the obtained time-ordered sequences of graphs the development of the entire graph can be investigated. However, one may also study what happens to single nodes as P. Polycephalum evolves. Given a graph in a time ordered sequence of graphs, let us pick any node u. Can we find pick a set of nodes from graphs in the sequence that are equivalent to u, that is, all nodes in the set are earlier or later versions of u with respect to time? To answer this question we compute a so-called node tracking which establishes the time development of all nodes in the graph. Crucially this tracking takes into account topological changes in the evolving graphs. The result of the tracking is stored as node properties of the graphs. Naturally, the program computing the tracking is include in the dataset. To the best of our knowledge, this type of data is made available for the first time through the KIST data set.
Finally, in addition to the actual data, i.e. images and graphs, the KIST Europe data set contains scripts and larger programs used to process and evaluate the data. Suitable configuration files specify the used regions of interest and the parameters used with NEFI. Thus it becomes possible to repeat the entire data production process from the raw images to the obtained filtered graphs including the tracking of nodes.
As part of the SMGR, the KIST Europe data set is well-structured and self-contained. In particular it offers sufficient documentation describing the data when navigating it on-the-fly using the browsing functionality.
Suggested usage
Previously, the data contained in the KIST Europe set has been the subject of initial analysis by the authors of the set (manuscript in preparation). When exploring time series of P. Polycephalum graphs, a particular focus was placed on edge properties, the structure of faces, cuts and percolation properties. In the process, additional questions regarding the nature of P. Polycephalum graphs naturally arose which are still open.
In particular, one would like to investigate if there is a similarity between P. Polycephalum networks and Voronoi graphs. The latter are well-studied and it is interesting to ask if a connection between their properties and the features of P. Polycephalum can be established. A different approach consists of investigating to what extend P. Polycephalum graphs are geometric spanners. Spanners have properties that enable efficient communication between different parts of the graph, a feature clearly relevant and desirable for an organism such as P. Polycephalum. Lastly, the information provided by the computed node tracking is yet to be used for the first time. What can be learned from the presence or absence of nodes? Can one identify patterns with certain structural properties? Given the large number of graphs in the SMGR, an investigation of such questions becomes a viable option.
Admittedly, most of the suggestions given so far are inspired by our own interdisciplinary research interests. However, future investigations are hardly limited to them alone. It is fair to say that any observable of relevance defined on a weighted graph can be studied using the KIST Europe set. In particular, we'd like to stress the implications for evaluating and guiding all sorts of theoretical modeling approaches based on graphs. Any model that produces a prediction that can be turned into an observable defined on a graph can immediately be evaluated on the KIST Europe set. This includes time dependent observables. Predictions that agree with the SMGR data increase the trust in a given model, while discrepancies between predictions and data may help suggest improvements. Thus, data contained in the KIST Europe set may be used to drive modeling efforts and help bridge the gap between theory and experiment.
Finally, we like to stress that the KIST Europe constitutes a flexible basis to work with since it contains a host of useful code and instructions. In particular, potential users are not limited to working with the graphs that are presently available. They are encouraged to start from the raw images and determine their own specific data selection and graph extraction procedures tailored to their particular research agenda. They may use the tools provided by us or deploy entirely different strategies to better suit their needs.